The Greens have published some interesting maps showing the impact of climate change and rising oil prices on transport. Based on 2006 census data, they show the proportion of people in the suburbs of eight cities who travel to work by car, colour coded from green (few) to red (lots). Wellington, with its well-developed commuter rail network, is mostly green [PDF]. But take a look at Auckland [PDF]:
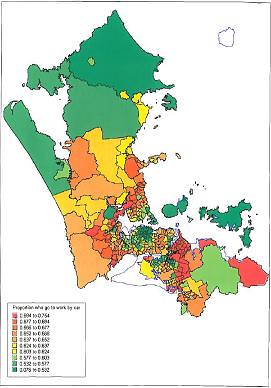
Orange and red all over the map - they don't have decent trains or buses, and so are forced to take the car. As oil prices rise, life for people in those orange suburbs is going to become a lot more expensive.
How much more expensive? We'd need more data. Earlier this year, The Oil Drum highlighted a study showing the impact of rising oil prices on Sydney suburbs, which had crunched together car use (annual vehicle kilometres), household incomes and petrol prices to work out the average percentage of household income which went on petrol. The results of an increase in petrol prices were not pretty. This data is available for New Zealand; maybe someone should do it for Auckland?